Data Analysis Just Got Fun
Discover the Best Tools to Make Your Data Dance
Do you remember the weird little ways in which our teachers taught us how to memorize things using Mnemonic devices?
Don’t know what I mean? I bet this would help…
Some people have curly brown hair through proper brushing (for the trignometric ratios)
Kindly Not Call Me A Cute Zebra In Lab How Can My Sister Grow Plant (for the reactivity series)
Mrs D Mrs I Mrs FFI Mrs C Mrs U Mrs LTY (Listen to the Audio to recall the movie, my favorite one as a child!)😇
So, you would ask me: Did I open this email to revisit my childhood or am I here to learn?
Of course, I wouldn’t have chosen it as my opener unless it was for you to learn something!
Now repeat after me:
I bet you’ll hear this picture a lot better than my audio, right?
Here’s what I mean….
You guessed it right! Today, we'll be diving into popular and accepted tools for both beginners and data scientists.
Excel and Google Sheets (Eggs..
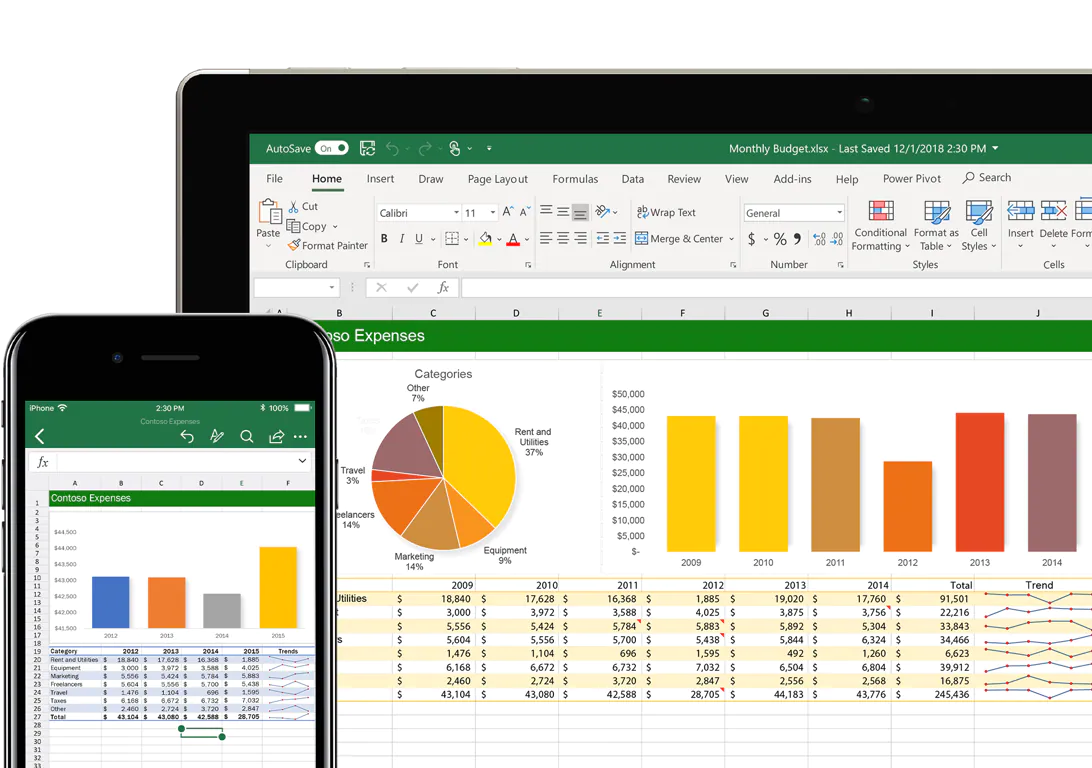
Excel is a spreadsheet software that is great for storing, editing, and manipulating data, as well as creating basic graphs and charts. It's like a trusty notebook for your data, it's a simple and convenient tool for organizing and analyzing your data. Excel has a wide variety of functions and formulas that make it easy to perform calculations and data manipulation tasks. It also has a wide variety of chart types, making it easy to present your data in a visually appealing way.
Excel also has the added benefit of being able to use VBA, the native programming language for Excel, to automate tasks if you find yourself using Excel for hours each day. VBA allows you to automate repetitive tasks, which can save you a lot of time and effort. Excel also has a limit of 1 million rows, which means it may not be suitable for analyzing big data.
Google Sheets is similar to Excel and is a free online version of Excel.
Tableau (…table…
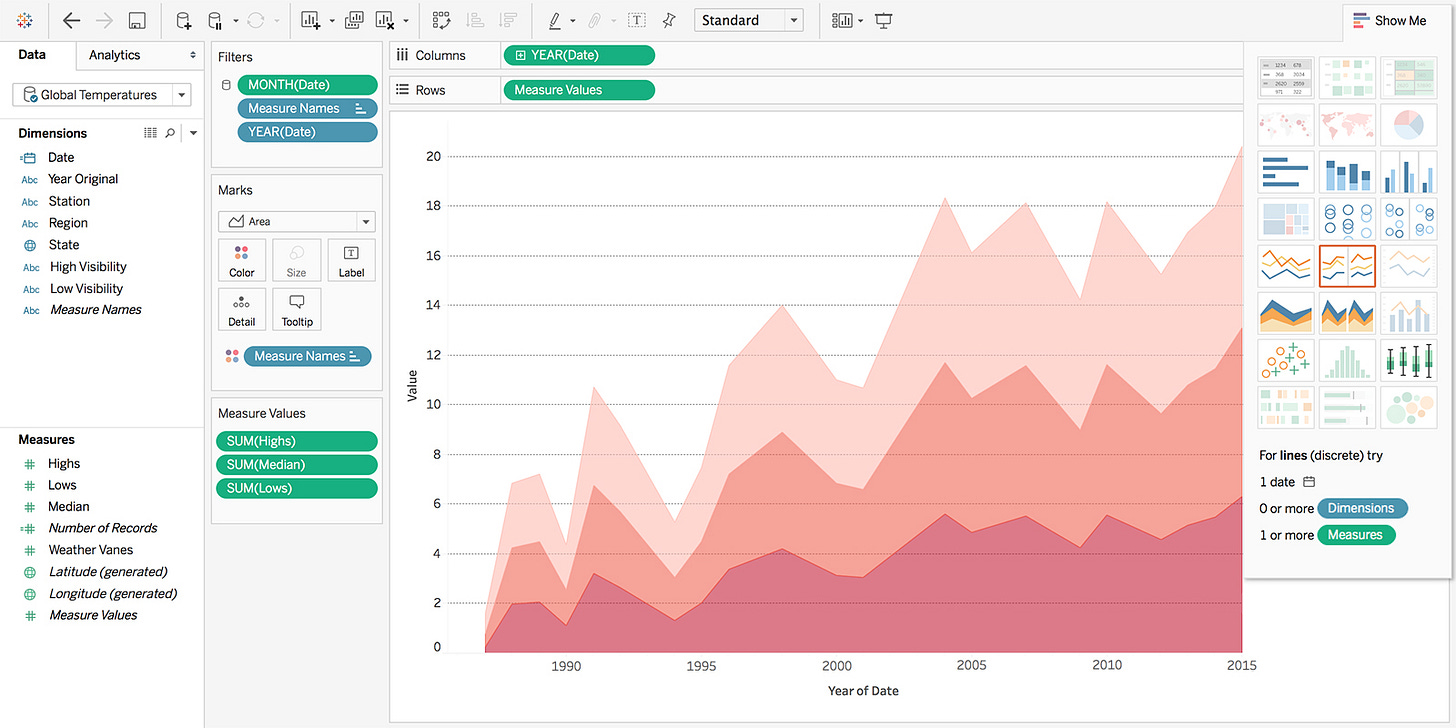
Tableau, the Picasso of data visualization. It is great for creating interactive and visually appealing dashboards and reports. It's like a paintbrush for your data, it allows you to create beautiful and informative visualizations that can help you discover insights and patterns in your data. Tableau is easy to use and has a wide variety of chart types, making it perfect for non-technical users.
Tableau also allows you to connect to various data sources, so you can easily pull in data from Excel, SQL databases, and other sources. It also has built-in data preparation capabilities, which means you can clean and shape your data before visualizing it. It's also great for exploring and discovering patterns in your data.
Python (…pe..
Python is a popular, high-level programming language that is widely used in data science and other industries such as finance and web development. It's like the Swiss Army Knife of programming languages - it can do a little bit of everything. Python is known for its simplicity and readability, making it a great choice for beginners.
Python has a wide variety of libraries and packages that make it easy to perform complex tasks in data science such as data manipulation, modeling, and visualization. Some of the most popular libraries include NumPy, Pandas, Matplotlib, and Scikit-learn. These libraries provide a wide range of functions and tools for performing tasks such as data cleaning, data visualization, and machine learning.
Python is also great for automating tasks and scripting, which can save you a lot of time and effort. It's like having a personal robot to do your data analysis for you. Python is also versatile, so it can be used for other tasks such as web scraping, natural language processing, and even building games and apps.
It's definitely worth learning if you're interested in data science or programming in general.
R Programming Language (…rakhe..
R is a programming language and environment that is specifically designed for statistical computing and graphics. It's like the superhero of statistical analysis. R is widely used in data science and is known for its powerful data visualization capabilities.
R has a large and active community, which means there are a lot of resources and packages available to help you perform complex tasks. R is also great for data manipulation and modeling. It has a wide variety of libraries such as dplyr and tidyr, which make it easy to perform complex data manipulation tasks such as filtering, grouping, and joining data.
R is also great for creating advanced statistical models and visualizations. It has libraries such as ggplot2 and lattice, which allow you to create beautiful and informative graphics. R is also a good choice if you're interested in performing more advanced statistical analysis, such as Bayesian analysis and machine learning.
SQL (…sarr gaye)
SQL, which stands for Structured Query Language, is a powerful tool for working with relational databases. It's like the duct tape of data analysis - it can fix almost anything. SQL is used to communicate with and manipulate databases, and it's a must-know skill for anyone working with data. It's great for performing tasks such as querying data, inserting and updating records, and creating tables and databases.
SQL is beginner-friendly, and there are many resources available to learn SQL, such as online tutorials and courses. Once you learn SQL, you'll be able to extract and manipulate data from databases quickly and easily. It's a valuable skill to have as it's widely used in many industries such as finance, healthcare, and e-commerce.
It's like being able to speak the same language as your data, it helps you understand each other better and you can communicate more efficiently.
Conclusion
In conclusion, when choosing a data analytics tool, it's important to consider the type of data you have, the size of the data, the level of technicality required, and the specific types of visualizations you need.
It's also important to consider the size of your company and budget. And remember, there's no one-size-fits-all solution when it comes to data analytics tools, so don't be afraid to experiment and try out different tools to see what works best for you.
Happy analyzing!
Free Resources (Bonus)
If you are wondering where you can learn these skills for absolutely free, We have got you covered!
If you have read it so far, kudos to you for finally taking your life seriously.
All I ask is for is some action…
And if you need some help along the way, apka bhai haazir hai.
On that note,
We conclude part 2 of the data analytics series
Hafsa and Zain from Team Inspired Analyst - signing off!


Where were you before? If I happened to knew about you back in mid 2021 before going to university, I bet my life could had been a lot more better by now. Don't know whether it is right time to enter tin data field or not (fear of AI) as I already know intermediate level SQL (PostgreSQL).