

Pt. 4 Value-Loaded Weekly Technical Analysis
Pt. 4 Value-Loaded Weekly Technical Analysis
Covering all the bases of the market


Fuse Cobalt Inc. (OTCQB: FUSEF) (TSX: FUSE). A must know company during the booming commodities supercycle. It could be the Driving Force behind the Next Phase of Battery Technology, Clean Energy, and Electric Vehicles! Click here to see 5 reasons why all eyes need to be on Fuse Cobalt Inc.
*This newsletter is sponsored by Fuse Cobalt Inc.
I am sure you must have successfully avoided last week’s market drop.
Well, that is if you read the weekly technical analysis.
Every Tuesday, I send an expected market analysis to potentially direct you to the right decision.
If you want in, upgrade your subscription at 30% off!
*cracks knuckles and shoots*
BTC/USDT
As you can see, since our market report last week, Bitcoin has dropped by a stunning 14% on average! It broke from the Rising Wedge, a classic trend-reversal pattern.
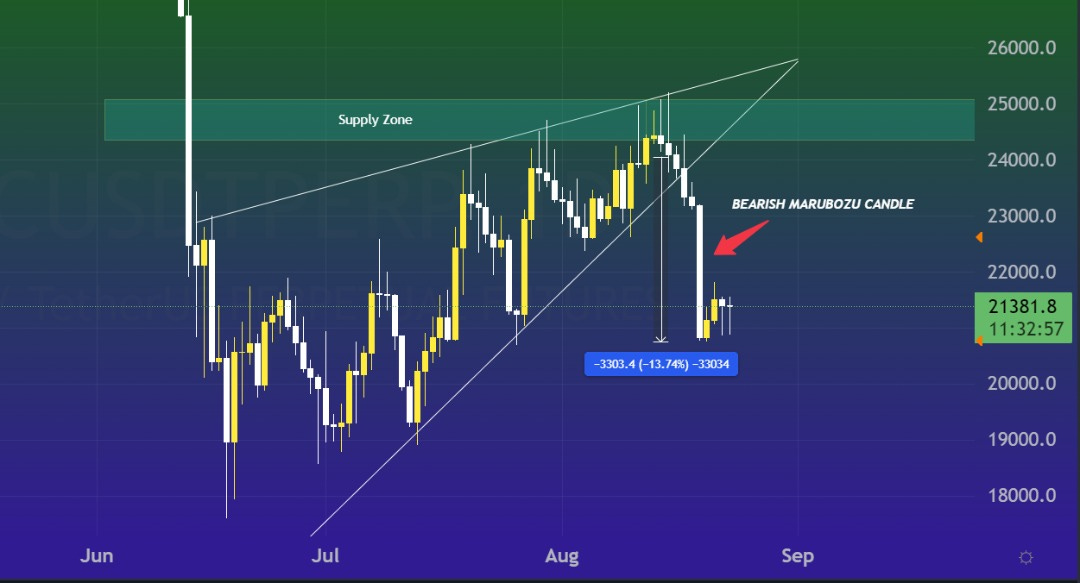
Additionally, Bitcoin created a Bearish Marubozu Candle on a daily timescale (red arrow pointing at it), which denotes a strong, ongoing bearish trend.
If the daily candle closes above the high of the Bearish Marubozu candle ($23200), this candle will no longer be valid.
The market is currently in a phase of consolidation following the dump; the $22600-$22800 level may be tested again. However, the bears are fierce right now.
ETH/BTC
On a weekly basis, Ethereum experienced one of its worst rejections. Its demand/support zone on the daily chart has flipped to the supply/resistance zone.
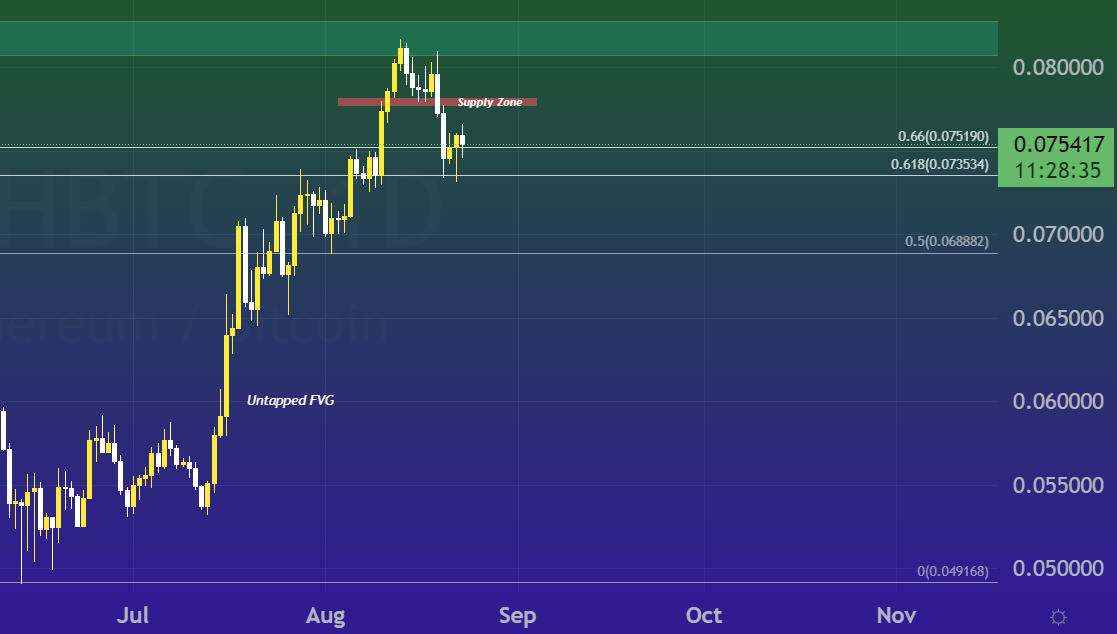
Fibonacci levels, however, show that it has rebounded from its golden pocket (0.618 fib level), which may allow it to retest the supply zone highlighted in red, but only IF Bitcoin overcomes its current resistance.
Last but not least, if the golden pocket is destroyed, $ETH will shortly reach the $1200–1400 level.
USDT Dominance
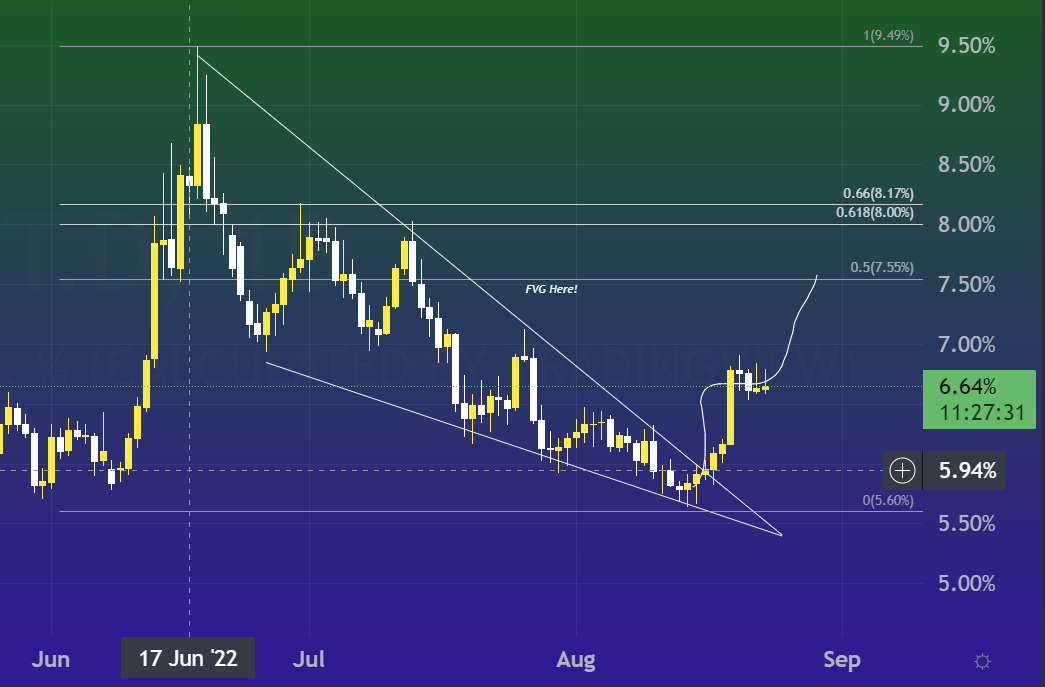
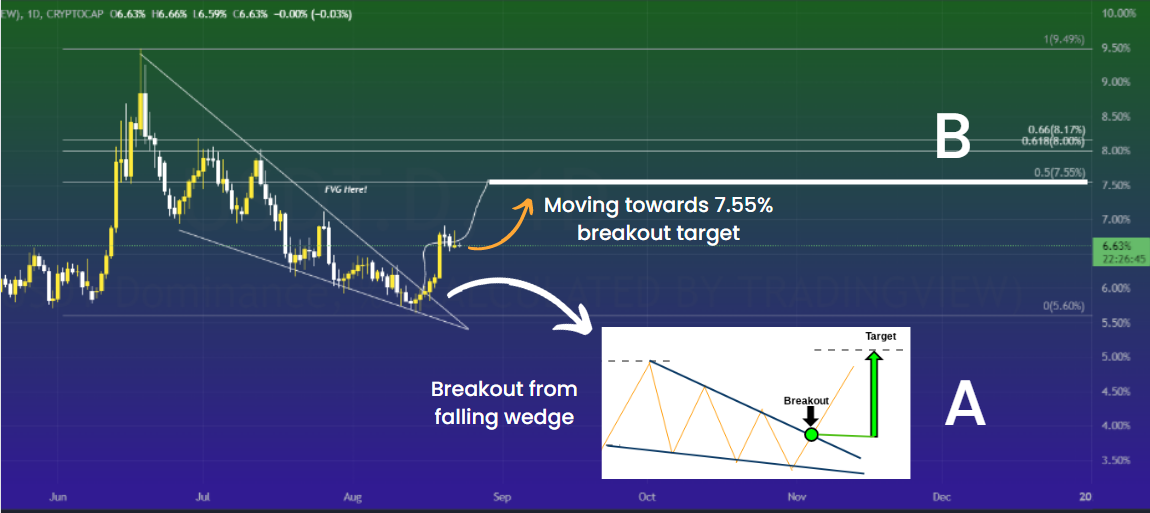
The Analysis can be broken down into two parts for better understanding, let’s label them as A and B.
A) As we reported last week, the USDT Dominance has broken out of its trend reversal pattern known as the Falling Wedge.
For those of you who don’t know, USDT Dominance is inversely proportional to the price of Bitcoin. As of right now, it has been consolidating on its supply zone, much like the majority of other coins.
B) If USDT dominance is able to flip the supply zone, it would be moving in the direction of the 0.5 fib resistance and the falling wedge breakout target, which is somewhere around 7.55%.
Total Market Cap
A similar pattern to Bitcoin was made by the total cryptocurrency market cap.
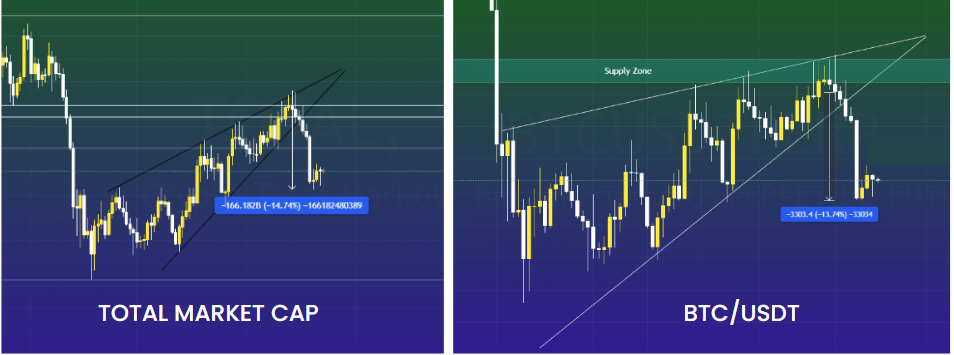
Following the breakdown, more than $166 billion was pulled out of the market, reducing the overall market cap back below $1 trillion.

However, following Bitcoin's brief surge from the $20800 region, the total market cap is back above the $1T threshold.
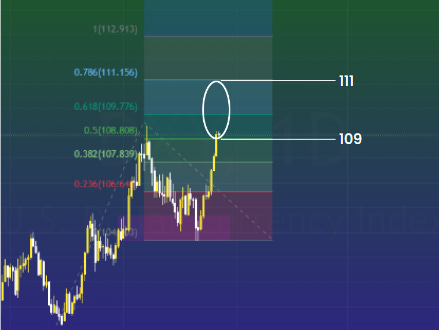
DXY (DOLLAR INDEX)
The Dollar Index also typically has an inverse relationship with the price of bitcoin, much like USDT Dominance does.
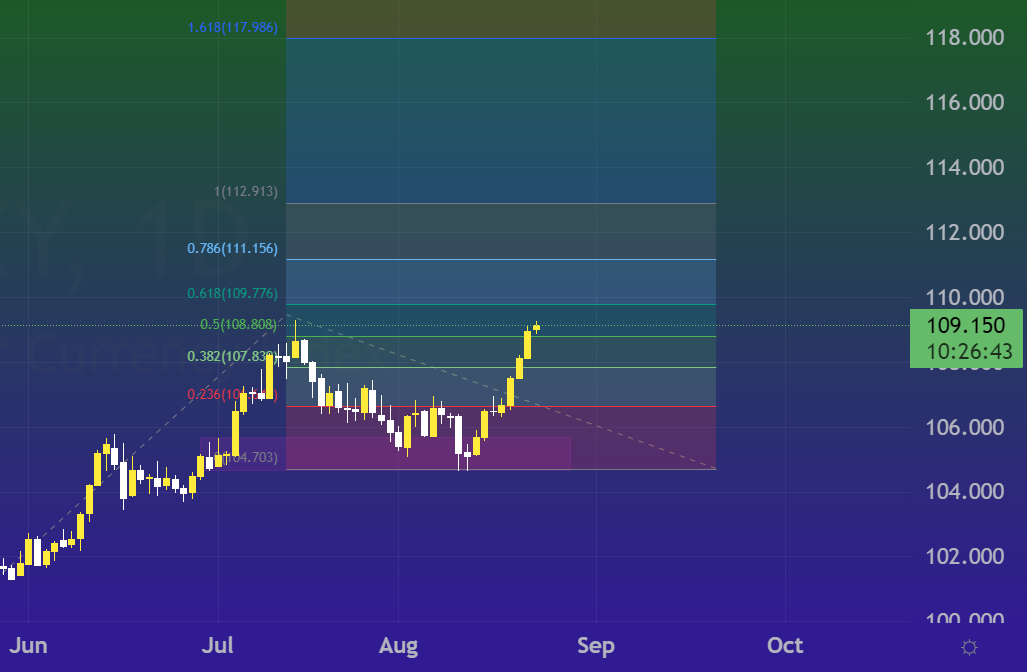
The DXY declined by slightly over 4% after reaching its most recent high, touching its Point of Interest (POI) before continuing to rise.
Using the trend-based Fibonacci levels, we can determine that it's probably going to reach the level between 109 and 111.
SPX
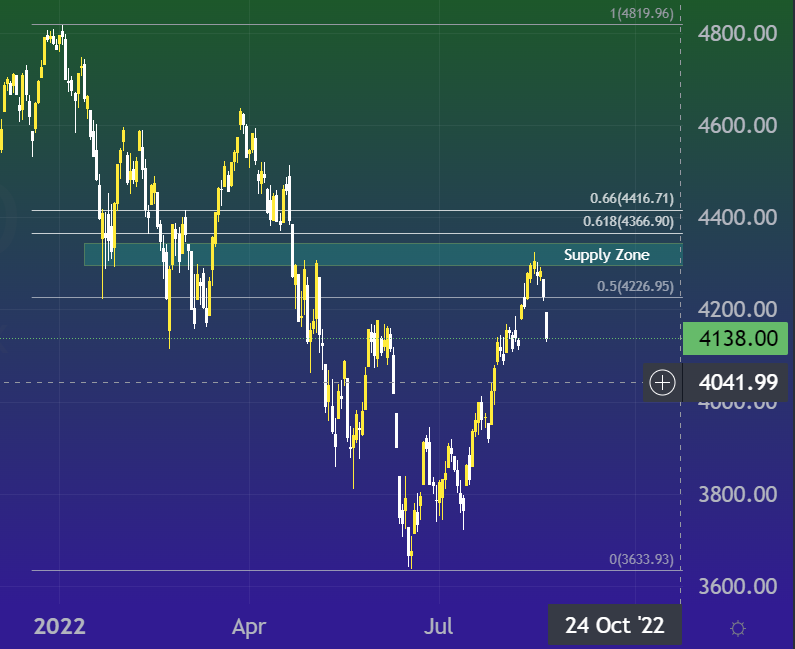
S&P500 showed a fantastic rally from its local bottom. However, it was unable to overcome its strong resistance zone on the daily timeframe.
As a matter of fact, on August 22nd, SPX fell by 2.22%. That’s the worst closing in the past 3 months for S&P500.
Although Bitcoin did not immediately react to the bloodbath in the stock market, it might do so in the near future.
This wraps up my Weekly Analysis of the 4th Week of August.
You must be feeling well-informed about the market
Don’t you agree?
PS. upgrade your subscription to paid with a discount to receive these updates on a weekly basis.
Until then,
Inspired Analyst - signing off!
Disclaimer: This is not financial advice or recommendation for any investment. The content is for informational purposes only, you should not construe any such information or other material as legal, tax, investment, financial, or other advice.
Here you go!